The dynGraph project
dynGraph is a visualization software that has been initially developed for the FactoMineR package, an R package dedicated to multivariate exploratory methods such as principal components analysis, (multiple) correspondence analysis and multiple factor analysis; dynGraph has been extended to allow the visualisation of data frames. The main objective of dynGraph is to allow the user to explore interactively graphical outputs provided by multidimensional methods by visually integrating numerical indicators.
The first basic feature of dynGraph is the connecting line that appears whenever the user moves a label associated with an object, i.e. an individual, a variable or a category. Labelling of the different objects displayed on the graph can be easily set. Colours can be assigned to individuals according to a categorical variable of interest.
One of the main features of dynGraph is the way objects are displayed. Objects are displayed according to their quality of representation, by default above the threshold of 0.8 with respect to a maximum of 1. Of course the amount of information to be displayed can be easily set by the user with a cursor: graphical outputs can be analyzed interactively from the most general piece of information to the most relevant one. Moreover, the font size of each label associated with an object is proportional to the importance of the object in the analysis which facilitates tremendously the interpretation of the results. Besides, different criteria can be used to assess the importance of an object and this information is calculated via R and the FactoMineR package.
Stay tuned and we hope you will find this project useful!
dynGraph: interactive visualization of "factorial planes" integrating numerical indicators
You can download (click here) the paper submitted to Journal of Statistical Software that describes the package.
dynGraph, the ins and outs
You can download (click here) a document that will explain you how dynGraph works.
A Tribute to P. Bourdieu's work
The following two graphs illustrate the need of an interactive approach when analyzing results provided by multivariate exploratory methods such as correspondence analysis ( "La distinction").
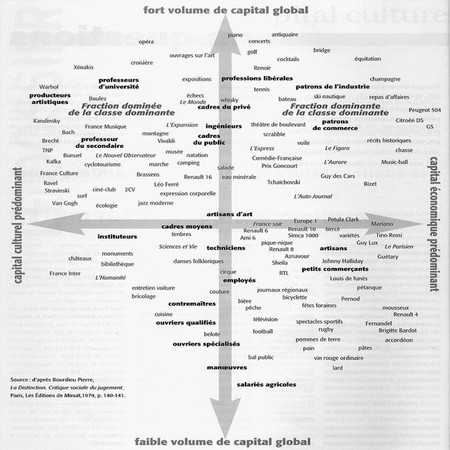
From "La distinction": "before" dynGraph.
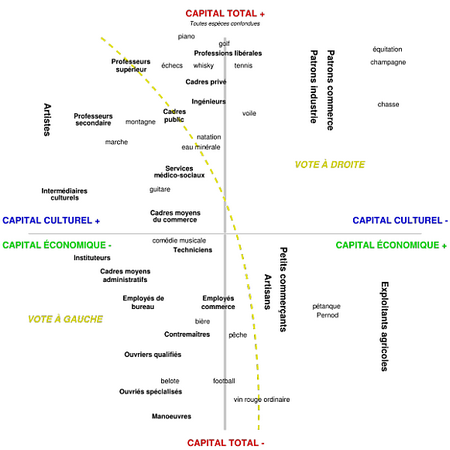
From "La distinction": "after" dynGraph.